Published: 2017-05-20
SUMMARY: Each year the Heritage Foundation releases an index of economic freedom. We plot the 2017 data, specifically the effect of economic freedom on GDP per capita. In order to check whether a trend really exists we subject the data to bootstrap analysis. The presence of a trend is confirmed.
Each year the Heritage Foundation releases an index of economic freedom. The index, including commentaries and raw data, can be accessed here.
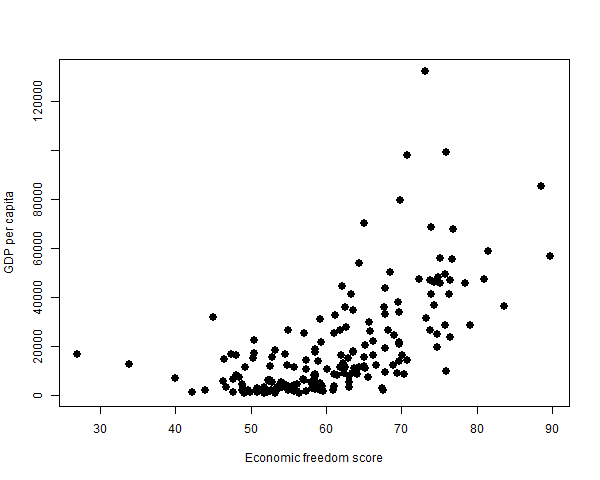
While freedom is good in and of itself, the data suggest that economic freedom is correlated with prosperity in the form of higher Gross Domestic Product (GDP) per capita. As shown below, the data are rather wild; if they convey a message it may not be entirely obvious:
In the scatter plot shown above most of the points seems to cluster at the bottom of the plot. In other words, there are many more poor countries than rich ones. This is in keeping with Pareto's law. The economist Wilfredo Pareto observed in the late nineteenth century that approximately 80% of the wealth accrues to 20% of the population. Furthermore, within that top 20%, 80% of the wealth accrues to the top 20%; and so on. This results in the distribution of wealth being highly skewed. Perhaps GDP per capita obeys a similar law.
Data arising from a Pareto distribution can be deskewed by taking the logarithm. Let's do that and see if the data look a little more regular.
.png)
To my eye the data now look more persuasive in terms of there being a positive corrlation between economic freedom and GDP per capita. However, toward the left hand side of the plot there are a couple of outliers that seem off-message, i.e., low economic freedom, but middling log GDP per capita. This tells us that economic freedom (as measured by the Heritage Foundation) is not the only determiner of GDP per capita. That is not surprising. Indeed, it would be surprising if something as complex as GDP per capita could be entirely or mostly explained by a single variable.
The Economic Freedom Index is usually presented in terms of country rank. This is sometimes used to rub it in to the United States which used to be in the top 10 but is no longer. As a citizen of the United States I find this appalling. My feelings aside, does replacing economic freedom scores with ranks change the plot substantially?
.png)
Notice that the plot has gone from sloping up to sloping down. This is because rank negatively covaries with economic freedom, i.e., the least free have the highest rank.
Replacing scores with ranks involves throwing away information. For example, if three adults have heights of 4 feet, 6 feet, and 8 feet and we transform these to ranks of 3, 2, 1 then we have lost the information that one of the adults is very short and one is very tall. On the other hand, if our measurement instrument is noisy then converting to ranks could conceivably remove more noise than signal. I have not studied the Economic Freedom Index methodology in detail but I would imagine measuring economic freedom is a good deal more noisy than measuring people's heights. It is possible that changing the independent variable from score to rank removes an appreciable amount of noise.
We can supplement the impression conveyed by our eyes by measuring the trend formally, that is, by fitting a straight line to the data. Given how diffuse the data are I prefer not to deploy ordinary least squares regression. This procedure is highly susceptible to outliers and extreme values. This is because it fits a line to the data by minimizing the sum of the squares of the deviations from the line. Squaring the deviations overweights large deviations and underweights small ones. This could result in one or a few points exerting an outsize influence on the result of the regression.
A better approach in the present case is to use median regression. This fits a line to the data by minimizing the sum of the absolute values of the deviations from the line. Median regression does not overweight or underweight any points. If you decide to use median regression you should know that it is an instance of quantile regression where the quantile is 0.5. In R the relevant package is quantreg while in Stata it is qreg. I am currently using the R quantreg package. Fitting a straight line to the data using median regression we obtain the following:
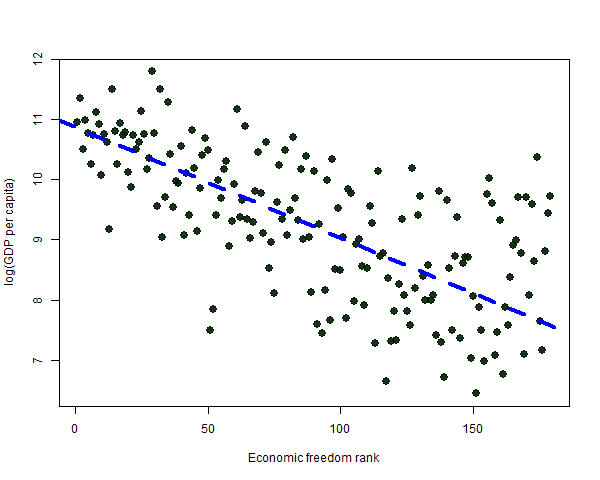
The median regression line indicates that GDP per capita declines as economic freedom declines.
It is rarely the case that a straight line tells the whole story about a data set. To explore nonlinearity in the data I fit it using the R loess function. The result is shown in the plot below, in which I also replicate the median regression line shown above:
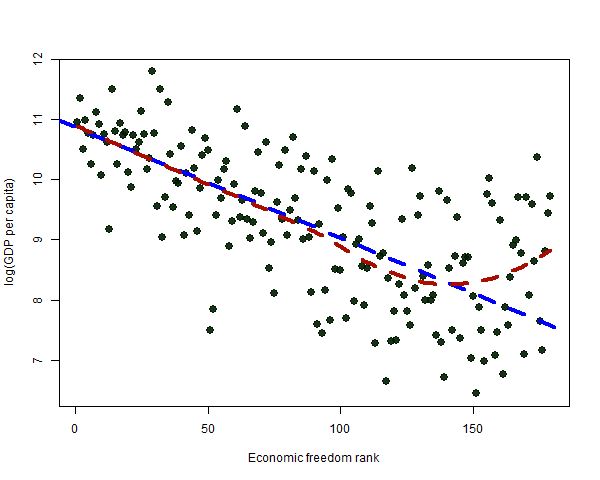
Over most of the plot the loess curve stays close to the median regression line. This suggests that for most countries—aside from the most repressive—there is (subject to considerable noise) an approximately linear relationship between GDP per capita and economic freedom rank.
A general framework for measuring the goodness of fit of a set of points to a line or curve is the following:
The goodness of fit of a model ("model 1") is measured with respect to a simpler model ("model 0"). The latter is usually the mean or median of the y values of the points. The function f transforms each deviation to a positive number by, for example, squaring it or taking its absolute value. In the context of median regression model 0 is the median of the data and the function f is the absolute value. I apply this measure of goodness of fit to two models: the median regression line, and the loess curve:
Goodness of fit
Median Regression: 0.28
Loess: 0.32
Both models account for about 30% of the absolute deviations. The loess curve does a bit better because it adapts to nonlinearities in the data.
We have found that GDP per capita tends to positively covary with economic freedom or, what is the same thing, that it tends to negatively covary with economic freedom rank (e.g., it is better to be number 1 than number 150). Is this finding the result of a few outliers or extreme values? In other words, is it real or is it a statistical artifact?
Using a statistical technique known as the bootstrap we can generate samples of the existing data in which data points are randomly eliminated. If the observed trend is a statisical artifact, then some of the bootstrap samples should fail to exhibit the trend.
I will not enter into an exposition of the bootstrap here as it would take us too far afield and there are many expositions available. I recommend "An Introduction to the Bootstrap" by Efron and Tibshirani.
With the R language it is very easy to generate bootstrap samples of a set of data and to subject these samples to any statistical analysis in which we are interested. I generated 1000 bootstrap samples of the Heritage Foundation data and measured the slope of the median regression line of GDP per capita as a function of economic freedom rank. The result: All 1000 slopes were negative:
Summary of 1000 bootstrap replications:
    Min. 1st Qu.  Median    Mean 3rd Qu.    Max.
  -0.023  -0.019  -0.018  -0.018  -0.017  -0.011
This gives me confidence that the negative slope measured above is not a statistical artifact.
Can we conclude that economic freedom tends to lead to better economic performmance? Correlation does not imply causation. That being said, it does seem reasonable that a cause and effect relationship could exist between economic freedom and prosperity.
The total number of countries in the data set is 186, but 7 countries are excluded from my analysis because of incomplete data:
Incomplete cases:
           name score rank   gdp gdppc
1          Iraq    NA   NA 544.1 15474
2 Korea, North    4.9  180  17.4    NA
3         Libya    NA   NA  92.6 14650
4 Liechtenstein    NA   NA   5.9 15704
5       Somalia    NA   NA   5.7    NA
6         Syria    NA   NA  68.0    NA
7         Yemen    NA   NA  75.5  2671